Cleanroom Microbiome Mapping: Applications of Metagenomics
Cleanroom Microbiome Mapping uses metagenomics to track recurring organisms and flora shifts that plate counts miss, and shows where it fits under Annex 1.
Introduction
On an ordinary Tuesday Morning, the trend report was clean. Plate counts sat within alert limits, and every isolate was filed as human skin flora.
Then a sequencing run on archived samples told a different story. A hardy spore former kept returning to the same transfer window, and its gene profile hinted at tolerance to the site's oxidising disinfectant.
Though this scenario is illustrative, it is based on patterns in published studies, not on a single real site.
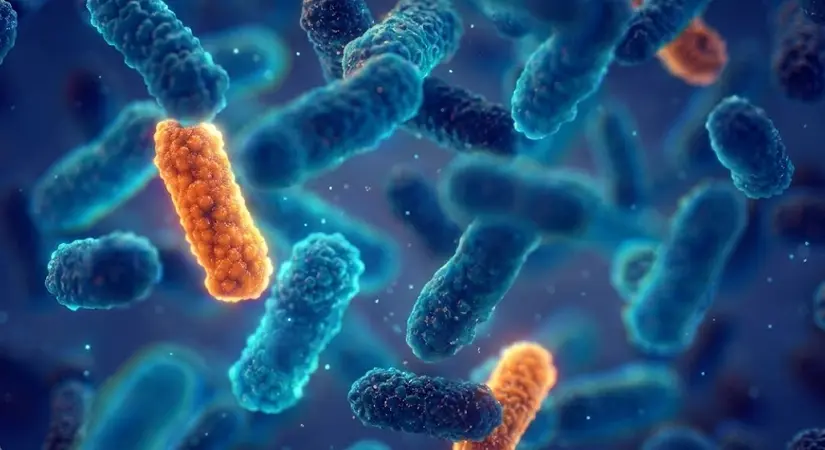
This is the promise of cleanroom microbiome mapping. It uses metagenomics to see the microbial flora that culture plates miss, and to track recurring organisms and flora shifts over months and years.
What is cleanroom microbiome mapping?
Cleanroom microbiome mapping is the systematic sequencing and tracking of the microbial community across air, surfaces, filters, personnel and equipment. Instead of asking "how many colonies grew?", it asks "who is there, how are they changing, and what can they survive?"
Two sequencing approaches dominate. 16S rRNA gene sequencing profiles bacteria through a marker gene, while shotgun metagenomics reads all the DNA in a sample. The second gives species-level detail and functional genes, including those linked to biocide resistance and antimicrobial resistance.
Why culture alone leaves blind spots
For years, environmental monitoring isolates were identified only to genus or group level. Culture also depends on organisms growing under standard laboratory conditions, and many do not.
A 2025 Japanese study of Grade B, C and D cleanrooms applied 16S rRNA metagenomic analysis to airborne bacterial DNA. Its authors found that many airborne microbes cannot be cultured, and co-author Mitsuru Mizuno noted the "limitations of conventional culture-based monitoring."
NASA-linked researchers make a similar point. Cleanrooms "are not sterile," and standard identification methods can miss low-abundance organisms.
Recurring organisms: who keeps showing up
Across pharmaceutical and spacecraft facilities, the same cast appears again and again. Human-associated Gram-positive cocci lead, followed by spore formers, environmental bacteria and fungi.
Tim Sandle's review of more than 9,000 isolates from different cleanroom grades found that typical flora are mainly skin-associated Gram-positive cocci. Environmental Gram-positive rods and water-associated Gram-negative rods turn up in lower numbers.
Organism group | Where it was reported |
|---|---|
Micrococcus, Kocuria, coagulase-negative Staphylococcus | Five-year UK study of Grade D, C and B changing rooms and corridors |
Staphylococcus epidermidis (15%), Micrococcus spp. (13%) | Grade D (ISO 8) non-sterile drug plant, Brazil, 12 months of sampling |
Cladosporium (23%) and Penicillium | Same Brazilian Grade D study (fungi) |
Micrococcus (11.2%), Bacillus (8.3%), Actinobacteria (5.81%), Paenibacillus (4.56%) | Sterile powder for injection facility, Shanghai |
Cutibacterium, Corynebacterium, Bacillus, Paracoccus | Airborne DNA in Grade B, C and D rooms, Japan |
Bacillus (predominant genus on surfaces) | Cell therapy cleanrooms, 39 samples sequenced |
Acinetobacter spp. | Three NASA spacecraft assembly cleanrooms |
Ascomycota (91%) and Basidiomycota (7.15%) of fungal reads | JPL and Kennedy Space Center cleanrooms |
The pattern is consistent. People are the largest everyday source, and spore-forming bacteria persist where cleaning pressure is highest.
How flora shifts happen
Flora shifts are changes in the type and number of organisms recovered over time. Sandle notes that a shift can signal resistant strains or weaknesses in cleaning practice.
Metagenomic studies point to four drivers:
Cleaning and disinfection pressure. In a spacecraft facility study, decontamination procedures shaped microbial communities more than sampling location did.
Selection for survivors. Cleaning sharply cut microbial numbers but barely reduced diversity. Spore formers and halophilic archaea were enriched.
Human movement and work tasks. In the 2025 Japanese study, cleanroom grade did not determine diversity. Local airflow, movement, tasks and equipment use did.
Campaign activity. During spacecraft assembly, relative pathogen abundance was lowest, yet potential virulence factors were higher than before or after assembly.
That last finding matters for pharma leaders. A quiet-looking count can hide a community with a different risk profile.
Key numbers at a glance
Metric | Finding |
|---|---|
Isolates in the largest pharma flora review | More than 9,000 |
Colony-forming unit reduction, uncontrolled area to ISO 5 | Up to about 400-fold |
Living share of 16S signatures (PMA-treated) | 45% in the changing area, 1% in ISO 5 |
Metagenomic samples in the JPL framework study | 51 (ISO 5 to ISO 8.5) |
Taxa shared across filters and surfaces | 644 in ISO 6 to 8.5, only 4 in ISO 5 |
Non-duplicate genomes matching no known species | 12 of 22 |
MALDI-TOF MS identification capability | 75.8% species level, 95.4% genus level |
Lessons from the toughest cleanrooms
Spacecraft assembly facilities are among the most intensively studied cleanrooms, which makes them a useful stress test for contamination control. NASA has tracked spacecraft microbial burden since the Viking missions of the 1970s, moving from culture to 16S sequencing and now to whole metagenomics.
Danko and colleagues sequenced 51 samples from Jet Propulsion Laboratory cleanrooms rated ISO 5 to ISO 8.5. ISO 5 samples showed lower richness than ISO 6 to 8.5, yet still carried a measurable microbial load.
The team found traits that complicate control, including biofilm formation, spore formation, radiation resistance and desiccation resistance. Of 22 non-duplicate genomes, 12 matched no known species. Growth-rate analysis suggested some bacteria, including Cutibacterium acnes, were actively replicating.
Earlier work reported recurrent isolation of extremotolerant bacteria from the cleanroom where Phoenix spacecraft components were assembled. Bashir and colleagues then ran the first functional metagenomics study of cleanroom pathogens and found virulence factors in every sample tested.
Evidence from pharmaceutical and cell therapy facilities
A 2024 case study at a sterile drug plant paired MALDI-TOF MS identification with sequencing-based strain typing. Analysis of single nucleotide polymorphisms linked contamination in critical areas to personnel flow.
A 2024 study of cell therapy cleanrooms sequenced 39 of 42 environmental colony samples. Bacillus predominated on surfaces, and hydrogen peroxide resistance was notably higher in the transfer window group.
The authors stressed that strict disinfection and good hand hygiene remain essential. The value for leaders is specificity: sequencing shows which location and which resistance profile deserve attention.
Sequencing is only half of the identification toolkit. See how MALDI-TOF and strain typing work together to trace contamination back to its source.
Read: The Next Frontier In Pharma QC: MALDI-TOF And Sequencing For Microbial Detection And Typing
Culture, MALDI-TOF and metagenomics compared
The methods complement each other. Here’s a summary table:
Question | Culture plates | MALDI-TOF MS | Metagenomics |
|---|---|---|---|
Detects non-culturable organisms | No | No (needs isolates) | Yes |
Species-level identification | Limited, often genus | 75.8% species, 95.4% genus | Yes, plus strain-level assembly |
Strain typing for source tracking | No | No | Via SNP-based typing in sequencing workflows |
Resistance and virulence genes | No | No | Yes |
Viability evidence | Yes (growth) | Yes (isolates) | Needs add-ons such as PMA or growth-rate analysis |
What Annex 1 means for microbiome mapping
The revised EU GMP Annex 1, published on 25 August 2022, made a facility-wide contamination control strategy (CCS) a central requirement. The CCS must define critical control points and assess whether the controls work.
Annex 1 also encourages rapid microbiological methods where they are shown to be equivalent or superior to classical ones. Its trending expectations include changes in microbial flora type and numbers.
Microbiome mapping fits as an investigative and trending layer. The research reviewed here does not position metagenomics as a replacement for compendial release testing, so treat it as a complement and validate any use within your quality system.
Annex 1 expects trending to catch shifts in flora type and numbers. See how alert and action levels and trending work in practice.
Read: USP <1116> – Alert/Action Levels & Trending in Pharmaceutical Cleanrooms
Limits and pitfalls
Low biomass. Cleanroom samples hold very little DNA, so controls and strict filtering are essential. In the JPL study, 14 of 24 taxa found in control samples were filtered out, and one of five replicates yielded no identifiable species.
DNA is not viability. Sequencing alone cannot show whether an organism is alive. Viability dyes such as propidium monoazide and growth-rate analysis help.
Amplification bias. One spacecraft study listed multiple displacement amplification as a limitation.
Analog evidence. Several landmark datasets come from spacecraft facilities, not drug plants. Use them as a design reference, not as proof for your site.
Tool dependence. No single classifier is fully accurate on cleanroom samples, so multi-tool analysis is recommended.
Conclusion
Cleanrooms will never be microbe-free. The aim is to understand the community well enough to keep it harmless.
Cleanroom microbiome mapping with metagenomics gives leaders a clearer view of recurring organisms, flora shifts and the resistance traits that decide which organisms survive. Start with a pilot tied to your contamination control strategy, and let the data guide your next investment.
FAQs
1. What is a cleanroom microbiome?
It is the community of bacteria, fungi and archaea living in a controlled environment. Cleanrooms limit particles and microbes, but they are not sterile. Cleaning cuts numbers sharply, while diversity falls much less.
2. How is metagenomics used in cleanroom monitoring?
Labs extract DNA from wipes, air samples or filters, then sequence and classify it. The results reveal species, strains, and genes tied to resistance or virulence. Comparing profiles over time exposes flora shifts.
3. Which microorganisms are most common in pharmaceutical cleanrooms?
Skin-associated Gram-positive cocci dominate, mainly Staphylococcus and Micrococcus. Bacillus and other spore formers, plus fungi such as Cladosporium, also recur.
4. Can metagenomics replace culture-based environmental monitoring?
The evidence supports using it alongside culture, not instead of it. Culture misses many airborne microbes, but sequencing needs viability and validation context. Annex 1 welcomes rapid methods only where equivalence is demonstrated.
5. Why do cleanroom microbial communities change over time?
Cleaning pressure, human movement, work tasks, equipment and airflow all shape the community. Disinfection favours survivors such as spore formers. Tracking these shifts helps teams catch cleaning gaps or resistant strains early.
Reporting on the science, business and regulation shaping the pharmaceutical industry.
More in Microbiology & CCS
All articles →
Active Air Sampling vs Settle Plates vs Contact Plates
Setting EM Alert & Action Levels (Grades A–D): A Practical Guide for Pharma Professionals
Discussion