by Mrudula Kulkarni
7 minutes
Designing an EM Program – Locations, Frequency & Maps in the Pharmaceutical Microbiology Industry
Learn how to design an EM program in pharma with risk-based locations, sampling frequency, and maps to strengthen contamination control.

Environmental Monitoring (EM) forms the backbone of microbiological control in sterile and non-sterile pharmaceutical manufacturing facilities. A vigorous EM program not only ensures regulatory compliance but also safeguards patient safety by minimising contamination risks.
Among the various components of such a program, three critical aspects- locations, frequency, and maps—determine how effective and scientifically justified the monitoring strategy is.
In this blog, we will dive deep into how to design an EM program that strategically defines monitoring locations, sets the right sampling frequency, and uses detailed EM maps to capture and visualise contamination risks.
Why Environmental Monitoring Matters
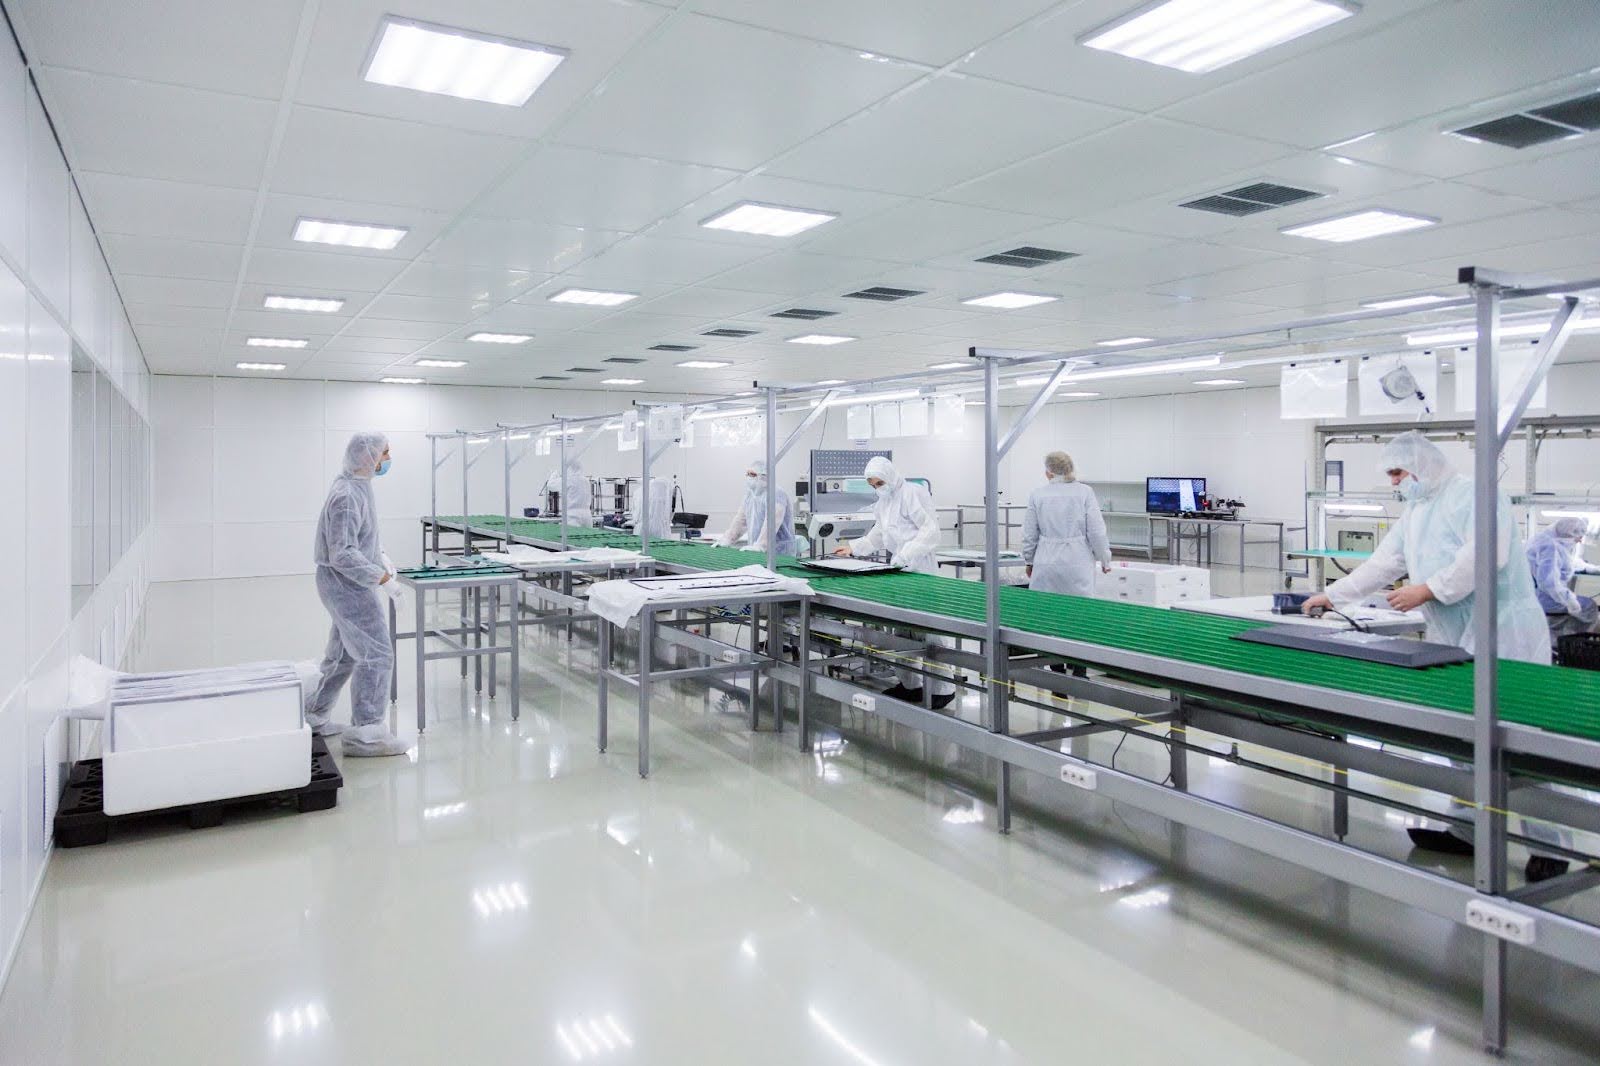
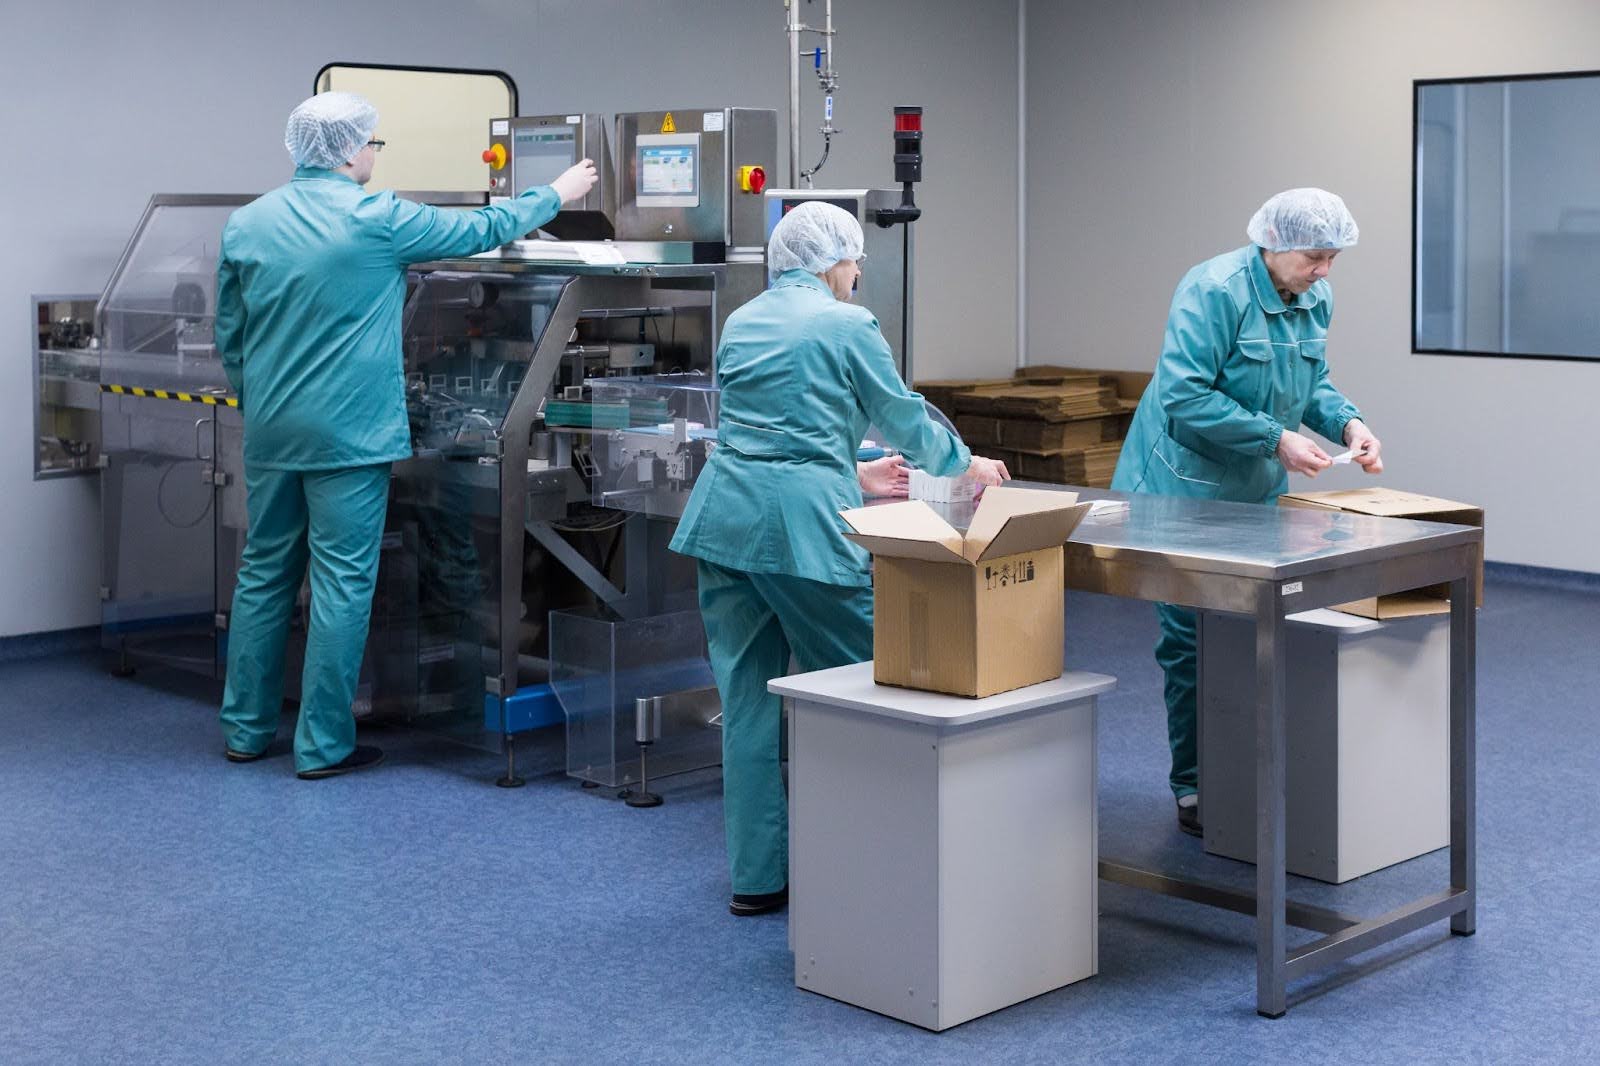
Pharmaceutical products, especially sterile injectables, biologics, and high-risk formulations, must be manufactured in controlled environments. Even a single lapse in microbial control can compromise product quality, leading to regulatory action or patient harm.
Regulatory authorities such as the FDA, EMA, and WHO emphasise the importance of establishing an environmental monitoring program tailored to the facility’s operations. USP <1116> alert and action levels provide the guidelines for establishing thresholds that align with global regulations and facility-specific needs.
The primary goals of an Environmental Monitoring (EM) program are to detect microbial and particulate contamination in real time, identify trends that could indicate deteriorating cleanroom control, support contamination investigations when excursions occur, and provide documented assurance that the environment remains suitable for aseptic processing.
To achieve these objectives, companies must carefully design the “where,” “when,” and “how” of monitoring. Defining alert and action levels in cleanroom monitoring helps set scientifically-backed thresholds for monitoring frequency and site selection.
This involves selecting risk-based sampling locations, establishing scientifically justified monitoring frequencies, and creating detailed EM maps that capture airflow patterns, personnel movements, and contamination risk zones.
Understanding active air vs settle vs contact plates is crucial for determining the best sampling methods at each of these locations.
Technically, regulators expect that EM programs are integrated into the site’s overall Contamination Control Strategy (CCS), ensuring proactive identification of risks and alignment with Annex 1 and FDA guidance requirements.
A key component in this integration is aligning monitoring efforts with ISO 14644 cleanroom classifications, which help define sampling and monitoring requirements.
Defining EM Locations – Choosing Where to Monitor
Selecting monitoring sites is not a random exercise; it requires a structured risk-based approach. Partnering with reliable environmental monitoring vendors and tools can support accurate site selection and consistent data collection.
Cleanrooms are dynamic environments with multiple personnel, equipment, and material interactions. Each of these is a potential source of contamination.
Risk-Based Selection of Locations
Monitoring locations should be identified through a combination of risk assessment, airflow visualisation studies, and process understanding. Factors such as personnel movement, product exposure points, and material transfer areas often dictate critical sites.
- Critical Control Points (CCPs):
- These include the most vulnerable areas where sterile products or product-contact surfaces are exposed. Examples are aseptic filling needles, vial capping zones, and open containers during compounding.
- Personnel Interaction Zones:
- Since humans are the largest contributors to contamination, sampling locations near operators’ hands, gowns, or frequently touched equipment are critical.
- Material and Equipment Transfer Points:
- Airlocks, pass-throughs, and transfer hatches often represent weak spots in cleanroom control and need dedicated monitoring.
- Airflow-Influenced Areas:
- Locations downstream of HEPA filters or areas with turbulent airflow should be evaluated through smoke studies and considered for sampling.
- Support Areas:
- While the primary focus is Grade A and B zones (ISO 5 and ISO 7), lower-classified areas such as Grade C and D are also monitored to understand contamination flow and prevent escalation.
Regulators expect monitoring to be justified scientifically. Annex 1 of the EU GMP guidelines (2022 update) specifically emphasises documenting the rationale for site selection. Thus, a well-designed program maps every location to a risk factor.
Determining Sampling Frequency – How Often Should You Monitor?
Once locations are established, the next step is to define how frequently these sites should be monitored. Over-monitoring can waste resources, while under-monitoring risks missing contamination events. The goal is to strike a balance guided by regulatory expectations, risk assessment, and data trends.
Routine Monitoring During Production
- Grade A Zones: Continuous monitoring is typically expected during operations. Active air samplers, settle plates, and particle counters remain in place throughout aseptic filling or compounding.
- Grade B Zones: Frequent monitoring during operations and at rest, often every batch, to capture personnel impact.
- Grade C/D Zones: Periodic monitoring, often daily or weekly depending on the operation type, material flow, and risk profile.
Frequency Adjustment Based on Risk and Data
An EM program must remain dynamic. Initial frequencies are set based on facility qualification, but adjustments are made once sufficient trend data is available. For instance, if a site consistently shows low or no recoveries, the frequency may be reduced, while recurring alerts or action level excursions may demand increased sampling.
Trend analysis is critical here. Regulators expect manufacturers to demonstrate that they are not only collecting EM data but also evaluating patterns. For example, a spike in recoveries during seasonal changes or personnel shift rotations should trigger a review of sampling frequency.
Media Fill and Validation Monitoring
In addition to routine monitoring, process simulations (media fills) require intense environmental monitoring. Every critical zone should be continuously monitored during media fills to replicate real operational stress.
EM Maps – Visualising Contamination Risk
Perhaps one of the most underappreciated yet essential tools in EM program design is the environmental monitoring map. These maps provide a visual representation of where samples are taken, what results are trending, and how contamination might move through the facility.
Maps serve as a real-time communication tool between microbiologists, operators, and quality assurance. During an EM excursion investigation, maps help visualize whether multiple contamination events are linked spatially.
Designing Effective EM Maps
An EM map should go beyond simple floor layouts. It should integrate:
- Sampling Points: Clearly marked positions for settle plates, contact plates, swabs, and active air samplers.
- Risk Zones: Colour-coded regions based on cleanroom classification (Grade A, B, C, D).
- Airflow Directions: Information from smoke studies, indicating how air moves across the cleanroom.
- Personnel and Material Flow: Arrows depicting how operators and materials move, showing potential contamination pathways.
Digital EM Maps and Future Trends
While traditional paper maps still exist, modern facilities are moving toward digital EM dashboards. These integrate monitoring data with facility maps, allowing dynamic overlays of contamination events, trend lines, and alert thresholds.
Advanced systems may even connect with AI-driven predictive tools to anticipate high-risk zones before contamination occurs.
Integrating Locations, Frequency, and Maps into a Coherent Program
An effective EM program is not about treating each of these elements in isolation but about creating a cohesive strategy.
- Locations define where monitoring happens.
- Frequency defines how often monitoring should occur.
- Maps provide the visual context to interpret and act on monitoring data.
Together, they form the foundation of contamination control. For instance, a site identified as high risk (e.g., aseptic filling needle) will not only appear on the EM map but will also be continuously monitored during every batch.
Similarly, if multiple EM sites near a material transfer hatch show increasing bioburden, the map will visually reveal a contamination hotspot, prompting an investigation and possible adjustment in monitoring frequency.
Regulatory Expectations and Best Practices
Both the FDA Guidance for Industry on Sterile Drug Products (2004) and the updated EU GMP Annex 1 (2022) outline clear expectations for EM design. The emphasis is on risk-based, documented justifications. Regulators no longer accept “one-size-fits-all” approaches; every facility must design its EM program to reflect its unique processes and risks.
Key best practices include:
- Documenting the rationale for site selection.
- Performing airflow visualisation studies to support map design.
- Using trend data to revise frequencies periodically.
- Investigating all excursions with spatial and temporal analysis.
- Ensuring EM data is integrated into the broader Contamination Control Strategy (CCS).
Common Pitfalls in EM Program Design
Many facilities struggle with EM program implementation because of avoidable errors:
- Overcrowded Maps: Adding too many sites without justification leads to confusion and inefficiency.
- Static Frequencies: Failing to adjust sampling frequency over time based on data trends makes the program rigid and less responsive.
- Poor Documentation: If justifications for location or frequency choices are missing, regulators often challenge the program during inspections.
- Lack of Integration: Treating EM as a standalone activity rather than linking it to cleaning validation, personnel training, and contamination control.
The Future of EM Programs
The pharmaceutical industry is steadily moving toward real-time, data-driven EM programs. Continuous monitoring sensors, digital mapping tools, and predictive AI models will transform how locations, frequency, and maps are used. Rather than reacting to contamination events, facilities will proactively prevent them.
We can expect:
- Wireless active air samplers feed real-time data into EM dashboards.
- Automated alert systems that recommend frequency adjustments.
- Integration of EM maps with digital twins of cleanrooms to simulate contamination scenarios.
Such advancements not only enhance compliance but also support faster, safer manufacturing.
Conclusion
Designing an effective EM program in pharmaceutical microbiology is a blend of science, risk assessment, and practical execution. Locations, frequency, and maps are not independent pieces but interconnected elements that ensure the program truly reflects contamination risks.
A well-designed EM program not only satisfies regulators but also provides confidence that cleanroom environments are consistently controlled.
As facilities embrace digital tools and real-time monitoring, the future of EM will be more predictive, proactive, and precise. Yet, the fundamentals remain unchanged: monitor the right locations, at the right frequency, and visualise risks clearly through maps.
When these principles are applied correctly, environmental monitoring becomes more than a compliance exercise; it becomes a powerful shield protecting both product quality and patient safety.
FAQ’s
1. What is an Environmental Monitoring (EM) program in pharmaceuticals?
An EM program tracks microbial and particulate contamination in cleanrooms to ensure sterile manufacturing conditions, product safety, and regulatory compliance.
2. How are EM sampling locations determined?
Locations are chosen using risk assessment, airflow visualisation, and process understanding, focusing on critical control points, operator zones, and material transfer areas.
3. How often should environmental monitoring be performed?
Frequency depends on cleanroom classification: continuous in Grade A, frequent in Grade B, and periodic in Grade C/D, with adjustments based on trend data.
4. Why are EM maps important in pharmaceutical microbiology?
EM maps visually represent sampling sites, airflow, and contamination risks, helping teams detect


