by Vaibhavi M.
8 minutes
Why Airflow Visualisation Has Become a Make-or-Break GMP Conversation
Airflow visualisation is now central to GMP — dynamic studies, contamination control, training and CCS, all reshaped by Annex 1 (2022).
Airflow visualisation studies, once treated as a routine validation checkbox, have moved to the centre of GMP conversations across sterile manufacturing facilities. Quality teams, regulatory inspectors, and engineering departments now treat these studies as proof points for contamination control, not just paperwork to file away.
For an industry built on protecting sterile products, the question "where does the air actually go" has become just as important as "what does the SOP say."
What Is Airflow Visualisation?
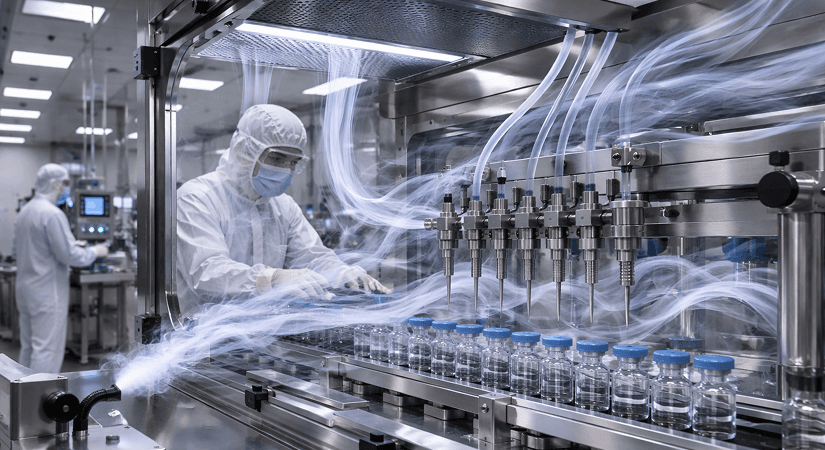
Airflow visualisation is a qualification technique used to study how air moves inside a cleanroom, isolator, or restricted access barrier system (RABS). Smoke or fog is released into the air stream, and the pattern is recorded on video. The footage shows whether air flows in a clean, unidirectional pattern away from critical zones, or whether it swirls, stalls, or pulls contamination toward open product, vials, or stoppers.
The technique itself is not new. ISO 14644-3 and the FDA's 2004 Aseptic Processing Guidance both reference smoke studies to confirm that unidirectional airflow protects Grade A and ISO 5 zones. What changed is how seriously regulators now expect facilities to use it, and how much evidence they expect to see.
Why It Became a Critical GMP Discussion

A few factors pushed airflow visualisation from a "nice to have" study into a frontline GMP expectation:
- The revised EU GMP Annex 1, published in 2022, placed airflow visualisation at the heart of the Contamination Control Strategy (CCS). It expects studies to be performed under dynamic conditions, meaning with personnel, equipment, and normal interventions present, not just in an empty, static room. This single change reshaped how many facilities plan their qualification programs.
- Video evidence is now expected, not just a written summary. Inspectors want to see the actual smoke pattern, reviewed and retained as part of the qualification package, so the finding can be revisited years later if needed.
- Rising FDA 483 observations related to poor or missing airflow studies, especially around aseptic filling lines, isolators, and open RABS, prompted companies to treat this as a recurring inspection focus rather than a one-time commissioning exercise.
- Modern aseptic technology, including isolators, RABS, and high-speed filling lines, created more complex airflow patterns that are harder to predict without visual confirmation. Equipment geometry, glove ports, and transfer hatches can all disturb airflow in ways a drawing cannot show.
In short, airflow visualisation stopped being a "we did it once during commissioning" activity and became proof that a facility understands and continuously controls its own airflow throughout the product lifecycle.
Smoke shows where the air goes.
The actual physics behind why microbes ride it is a deeper story.
→ Read: How Airflow Controls Microbial Movement In Pharma And Healthcare Environments
Static vs Dynamic Conditions
One of the biggest shifts is the move from static-only studies to mandatory dynamic studies. The table below shows the difference.
Condition | When Performed | What It Shows | Current Expectation |
|---|---|---|---|
Static | The room is empty, no personnel or equipment running | Baseline airflow pattern under ideal conditions | Still useful as a reference point |
Dynamic | Personnel present, equipment running, normal interventions happening | Real-world airflow behaviour during actual production | Now expected by Annex 1 for Grade A/B areas |
Static studies alone are no longer considered sufficient evidence that a critical zone is protected. Regulators want to see what happens when a gloved hand reaches into an isolator, or when a stopper bowl is refilled mid-batch, since these are the moments when contamination risk is highest.
How an Airflow Visualisation Study Is Performed
A typical study follows a structured sequence:
- Define the scope — Identify the critical zones, interventions, and equipment configurations to be studied, including the filling needle area, stopper feed, and vial transfer points.
- Generate smoke or fog — Use a controlled, residue-free smoke generator that does not leave deposits or affect particle counts in the room.
- Record on video — Capture footage from multiple angles so reviewers can clearly see airflow direction, turbulence, and recovery time after a disturbance.
- Perform under both conditions — Run the study at rest and again during simulated or actual operation, including planned interventions.
- Review and document — A qualified reviewer assesses the footage against predefined acceptance criteria, and the video is retained as objective evidence in the validation file.
- Address any deviations — If turbulence or reverse airflow is observed, the root cause is investigated, and corrective engineering changes are made before requalification.
Tools Commonly Used
Most facilities rely on a small set of proven tools for these studies: titanium tetrachloride-free fog or smoke generators, high-resolution video cameras positioned at multiple angles, lighting that makes smoke patterns visible without affecting airflow, and sometimes laser sheet illumination for closer inspection of critical zones. Computational Fluid Dynamics (CFD) modelling is increasingly used alongside these physical tools, especially during facility design, to predict airflow behaviour before construction begins.
Common Findings During Airflow Studies
Even well-designed cleanrooms can show unexpected airflow behaviour once smoke is introduced. Frequent findings include:
- Dead zones where air barely moves, allowing particles to settle near the product
- Turbulence caused by equipment edges, operator movement, or poorly placed sensors
- Eddy currents that pull air back toward a critical zone instead of away from it
- Slow recovery time after an intervention, where airflow takes too long to return to its protective pattern
These findings often lead to changes in HVAC design, equipment layout, or operator behaviour, proving the study's value goes well beyond compliance paperwork.
Who Is Usually Involved
Airflow visualisation is rarely a one-department job. Quality Assurance defines acceptance criteria and signs off on the final report. Engineering or HVAC specialists run the smoke generator and adjust airflow if problems are found.
Operations or manufacturing staff participate in the dynamic study, so the airflow is tested under conditions that match real production conditions. Validation teams compile the video evidence, raw data, and conclusions into the qualification package that inspectors will eventually review.
A Quick Airflow Visualisation Checklist

- Critical zones and interventions were identified before the study
- Smoke/fog generator qualified and residue-free
- Static condition study completed and recorded
- Dynamic condition study completed with realistic interventions
- Video footage retained as part of the qualification record
- Acceptance criteria defined in advance, not after reviewing results
- Deviations investigated with documented root cause
- Requalification schedule defined, especially after layout or equipment changes
What Regulators Expect Going Forward
Both EU and FDA inspectors increasingly ask facilities to show, not just tell, how airflow protects the product. The expectation now includes airflow visualisation as a documented part of the Contamination Control Strategy, studies repeated after any change to equipment, layout, or HVAC, dynamic studies covering realistic worst-case interventions, and video retained, reviewed, and referenced during routine requalification rather than only at initial qualification.
CFD modelling does not replace the physical study. It complements it. CFD helps predict airflow behaviour on paper, while the physical smoke study confirms that the prediction matches reality once the room is built and running with real people and equipment inside.
Final Thoughts
Airflow visualisation has earned its place as a serious GMP discussion because it answers a question that paperwork alone cannot answer: does the air in this room actually protect the product? With Annex 1's renewed focus on contamination control and growing inspection scrutiny, facilities that treat airflow studies as a continuous quality practice rather than a one-time event are better positioned to stay compliant and, more importantly, keep their products safe.
FAQs
1. What is airflow visualisation in GMP?
It's a study where smoke or fog is used to record and confirm how air moves inside a cleanroom or isolator, protecting critical zones from contamination.
2. Why does EU GMP Annex 1 focus on airflow visualisation?
Annex 1 (2022) made it part of the Contamination Control Strategy and requires dynamic studies with personnel and equipment present, not just empty-room testing.
3. What's the difference between static and dynamic airflow studies?
Static studies test an empty room; dynamic studies test airflow during real operation, including interventions, which is now the regulatory expectation.
4. How often should airflow visualisation studies be repeated?
They should be repeated after any change to equipment, layout, or HVAC, and as part of routine requalification, not just at initial qualification.
5. Can CFD modelling replace physical smoke studies?
No. CFD predicts airflow behaviour during design, but physical smoke studies are still required to confirm that real-world performance matches the prediction.