by Dr. Nasreen J
8 minutes
The Sampler That Was Watching the Wrong Air
How a compliant environmental monitoring programme became a blindfold, and what every sterile facility should ask before the next contamination event.
I want to start with an uncomfortable truth: data can lie by omission. Not through falsification — simply by being placed where it is never challenged. I have seen this play out in facilities that were, by every metric, doing things right. Clean trends, compliant counts, and a contamination event that nobody saw coming.
The case described here is a composite drawn from real investigation patterns in sterile manufacturing. The details have been generalized, but the failure mode is authentic — and it is far more common than the industry acknowledges.
“Stable trends do not mean a controlled environment. Sometimes they just mean the sampler is sitting in the wrong place.”
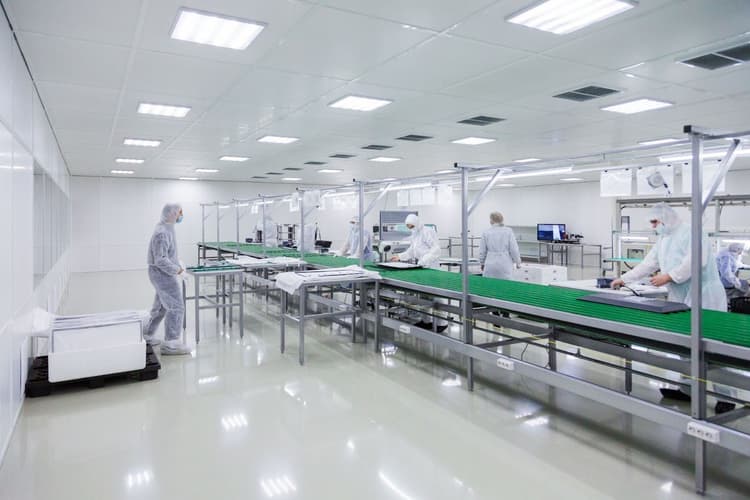
It happened on a perfectly ordinary Tuesday
The contamination event did not unfold against a backdrop of chaos no equipment failure, no staffing crisis, no deviation log already flagged. It happened on a routine production shift, in a room with years of clean EM data behind it.
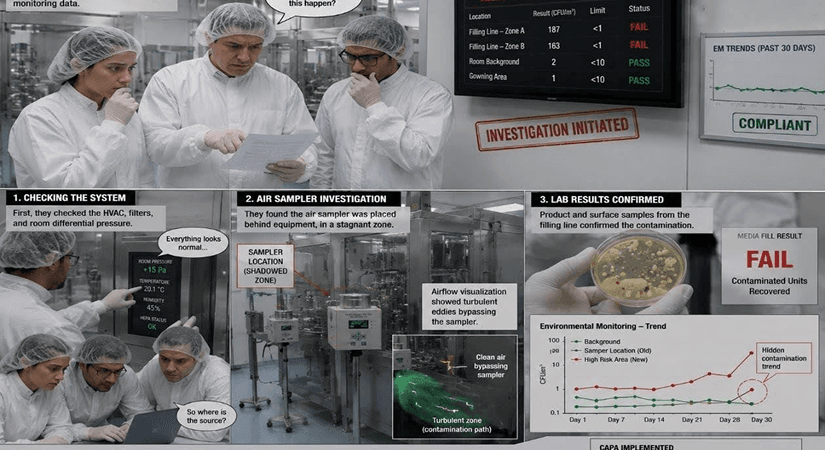
When the investigation team pulled historical records, they found something deeply unsettling. The active air sampler positioned at the heart of the filling line had returned consistently low counts for as long as anyone could remember. No excursions. No trends worth worrying about. And yet, a contamination pathway had been active for months quietly, invisibly, undetected.
10–30× particle count rise during manual interventions vs. at-rest baseline [5] | 15 cm peak particle values recorded from product surface during filling operations [5] | 0.8 m distance operator-generated particle plumes can travel within seconds [3] |
|---|
The illusion of a working EM Programme:
Environmental monitoring is, in principle, a representative sampling strategy — not a guarantee that the environment is clean, but evidence that we are looking in the right places. The EU GMP Annex 1 (2022 revision) states this explicitly, requiring that monitoring locations be justified based on contamination risk assessment rather than historical convenience [1]
In practice, many facilities suffer from what I call static inertia. Monitoring locations are established at commissioning, validated at that point in time, and then never revisited — even as equipment is upgraded and operational patterns shift. ISO 14644-2:2015 explicitly recognizes that monitoring plans should be reviewed when changes occur to the facility, process, or equipment [2].
Your monitoring map is only as good as the science behind it. Learn how to design risk-based EM locations, sampling frequencies, and monitoring maps that evolve with your facility.
→ Designing an Environmental Monitoring Programme That Works
The physics nobody talked about:
The root cause in this case was elegant in its simplicity. The sampler had been placed where it was convenient for the operator to access — not where the science demanded it should be.
Because of the filling equipment layout, the sampler sat in a shadow zone. Laminar airflow from the HEPA ceiling filters struck the equipment housing, diverted around it, and pooled in a pocket of stagnant air directly beside the sampler. The sampler was breathing the safest air in the room — air that had already passed through the critical zone and moved on.
Meanwhile, every time an operator performed a manual intervention, turbulent air carrying viable particles from the gown surface swept directly across the product path. The sampler never saw it. This is consistent with Whyte et al. (2015), who demonstrated through CFD modelling that operator movements can generate particle plumes travelling 0.3–0.8 m from the body surface within seconds of an intervention [3].
“The facility had turned a safety-critical device into an expensive piece of furniture that told them what they wanted to hear, not what they needed to know.”
The problem with at-rest qualification:
Qualification studies are typically performed in the at-rest state: no operators, no product, no movement. The room is the best version of itself. But sterile manufacturing does not happen in an at-rest room. The moment a person enters the space, the thermal and kinetic physics change — arms move, doors open, and heat from the human body creates convective plumes that lift particles upward and laterally.
A 2019 study by Baer et al. in the PDA Journal of Pharmaceutical Science and Technology measured airborne particle concentrations during simulated filling operations and found manual interventions increased local particle counts by a factor of 10 to 30 compared to at-rest baseline, with peak values occurring within 15 cm of the product surface [5]. If your monitoring programme was designed around an at-rest reality, it is designed around a room that does not exist during production.
The breakthrough: dynamic smoke studies
The breakthrough came not from a spreadsheet or retrospective analysis. It came from smoke. When the team introduced smoke generation into the filling suite during a production run — with operators working and interventions happening as they would on any normal day — the picture became impossible to ignore.
The white plumes showed the sampler sitting in its dead zone, completely bypassed by the contaminated air flowing past the product path for months. The correlation was unambiguous: microbial excursions aligned in time and location with specific manual interventions. ISO 14644-3:2019 covers airflow visualisation methodology, including the requirement that tests be conducted under conditions representative of normal operation [8].
Smoke studies reveal what particle counts can't. Understand how airflow physics, laminar flow, and operator movement shape contamination pathways inside pharmaceutical cleanrooms.
→ How Airflow Controls Microbial Movement in Pharma Cleanrooms
CAPA: more than moving a box
The corrective action went beyond relocating a piece of hardware. The harder part — the part that determines
whether the same failure mode re-emerges — is the cultural and procedural change that accompanies it.
Risk-based placement Sampling locations re-established through structured risk assessment. Rationale for each location documented, not inherited from prior validation. [1, 7] | Dynamic validation New EM map validated under worst-case operational conditions — maximum staffing, highest-frequency interventions. Not at rest. [8] |
|---|---|
Change-control trigger Any modification to equipment layout or process flow now automatically requires assessment of whether the EM programme remains representative. [1] | Science-first question The question shifted from 'Is this location compliant?' to 'Does this location represent the actual risk to the product?' [7] |
Lessons for your facility
When were your current EM locations last reviewed against your current process? If the answer involves years, that is a gap worth closing.
Has your facility performed smoke studies under full operational conditions — with operators at realistic intervention frequencies? At-rest qualification characterises a room that does not exist during manufacturing.
Do your sampling locations include zones where manual interventions occur? Or do they favour accessible, low-risk positions where it is easier to obtain a compliant result?
Is your EM programme embedded in a Contamination Control Strategy linking monitoring data to contamination pathways — or does it function as a standalone compliance tick-box?
The regulatory direction of travel
The 2022 revision of EU GMP Annex 1 represented the most significant update to aseptic manufacturing guidance in two decades. The Contamination Control Strategy requirement signals a fundamental regulatory expectation: manufacturers must understand not just whether their environment is clean, but why it is clean, and what could make it otherwise [1].
The US FDA guidance on sterile drug products produced by aseptic processing has long held that EM programmes should be designed to detect contamination in areas at greatest risk [10]. The regulatory expectation has not changed — the articulation of it has become more demanding.
“When you stop questioning your monitoring map, you normalize invisible risks. The data will look fine. Until it doesn’t.”
References
- European Commission. EU GMP Annex 1: Manufacture of Sterile Medicinal Products. Brussels: European Commission; 2022.
- ISO 14644-2:2015. Cleanrooms and Associated Controlled Environments — Part 2: Monitoring to provide evidence of cleanroom performance related to air cleanliness by particle concentration. Geneva: ISO; 2015.
- Whyte W, Hejab M, Whyte CW, Green G. Experimental and CFD airflow studies of a cleanroom with special respect to air supply inlets. Int J Ventilation. 2015;9(3):197–209.
- ISO 14644-1:2015. Cleanrooms and Associated Controlled Environments — Part 1: Classification of air cleanliness by particle concentration. Geneva: ISO; 2015.
- Baer T, et al. Particle emission during manual interventions in a pharmaceutical filling process. PDA J Pharm Sci Tech. 2019;73(1):20–32. doi:10.5731/pdajpst.2018.008995
- Ljungqvist B, Reinmüller B. Interaction between air movements and the dispersion of contaminants: clean zones with unidirectional air flow. PDA J Pharm Sci Tech. 2006;47(2):60–69.
- Parenteral Drug Association. PDA Technical Report No. 13 (Revised): Fundamentals of an Environmental Monitoring Program. Bethesda, MD: PDA; 2014.
- ISO 14644-3:2019. Cleanrooms and Associated Controlled Environments — Part 3: Test Methods. Geneva: ISO; 2019.
- Sandle T. A review of cleanroom microbiological monitoring: basics, environmental monitoring and rapid methods. Eur J Parenteral Pharm Sci. 2011;16(1):11–22.
- US FDA. Guidance for Industry: Sterile Drug Products Produced by Aseptic Processing — Current Good Manufacturing Practice. Rockville, MD: FDA; 2004.